来源:环球教育
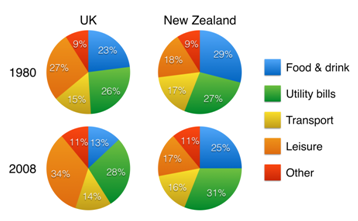
小编:环球教育 4771The charts below show household spending patterns in two countries between 1980 and 2008.

要点分析:
本图是5个花费在1980-2008年两个国家的比较。
1 外部比较(1980-2008):
英国家庭的休闲活动开销比新西兰要多出很多。
2 “由内到外”比较:
两个国家家庭的饮食花费都是下降,英国显著下降23%-13%,新西兰轻微下降29%-25%
杂费则是呈上升趋势:26%-28%,27%-31%
交通费都是略微下降1%
休闲活动的开销,英国显著增加,而新西兰则略微下降
用于其它活动的开销,上升的幅度都是一样
概述:
对象特点合并:
两个国家的家庭在饮食、交通费的开销都是下降的;而在杂费和其它费用方面都是上升的。
Example:
The charts compares five spending aspects between the U.K and New Zealand during twenty-eight years.
British households spent much more money on leisure activities than New Zealand ones from 1980 to 2008. The household expenses on food and drink between the two countries showed a downward trend. In 1980, the proportion of spending on food and drink in the U.K was 23%, significantly dipping to 13%, but the figure in New Zealand was 29%, slightly dropping to 25%. The expenditure on utility bills saw an increase from 26% to 28% in the U.K and from 27% to 31% in the New Zealand.
For British and New Zealand households, the money spent on transport both marginally fell by only 1% over 28 years. But the expenses on leisure were opposite during the period, with a dramatic growth by 7% in the U.K and a slight decline in New Zealand. The expenses on other activities in both countries increased at the same rate.
In conclusion, the spending on food and drink and transport in both countries decreased over twenty-eight years, but there was a general rise in the cost of utility bills and other activities during the same period.
以上就是环球教育老师为大家提供的雅思小作文(饼图)分析及范例,希望对大家有所帮助!
最后,环球教育祝大家考试顺利!